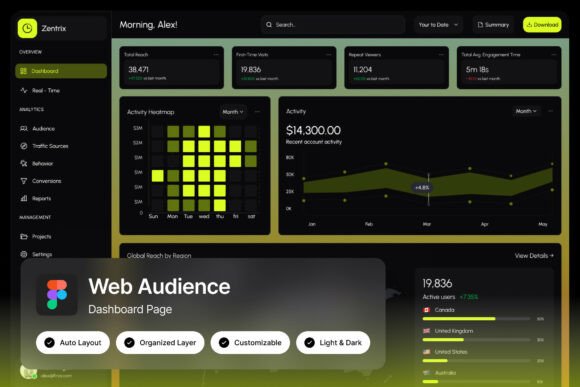
Zentrix Audience Dashboard: A High-Contrast Analytics Tool for Power Users
The Zentrix Audience Dashboard is a specialized web analytics interface designed for professionals who need immediate, actionable insights into audience behavior. Built with a bold, dark theme and a high-contrast yellow-green color scheme, it offers a visually striking and functional layout that prioritizes clarity and efficiency. This dashboard is ideal for growth hackers, SaaS teams, and analytics designers looking to streamline their data interpretation process.
Understanding the Role of Zentrix in Data-Driven Workflows
Zentrix fits into a broader data-driven workflow by providing a centralized hub for audience intelligence. Whether you're analyzing user engagement, optimizing content strategy, or refining product features, Zentrix helps you visualize key metrics without the clutter of traditional dashboards. Its design is tailored for users who want to quickly access critical information and make informed decisions based on real-time data.
This tool is particularly useful when working on projects that require rapid iteration and deep audience understanding. For example, during a marketing campaign launch, Zentrix can help track visitor behavior, identify engagement patterns, and highlight areas for improvement. Its segmentation panels allow users to filter data by demographics, traffic sources, or user behavior, making it easier to target specific groups effectively.
Key Features That Enhance Workflow Efficiency
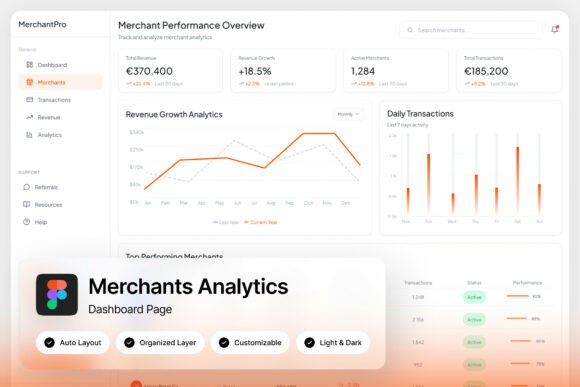
One of the standout features of Zentrix is its real-time visitor map, which provides a dynamic view of where your audience is located and how they interact with your site. This visual representation helps identify geographic trends and potential opportunities for expansion. Combined with heatmap indicators, users can see which sections of a page receive the most attention, allowing for strategic content placement and design adjustments.
The dashboard also includes detailed engagement metrics, such as time spent on page, bounce rates, and conversion rates. These metrics are presented in an easy-to-read format, ensuring that even complex data is accessible at a glance. The high-quality screen resolution of 1440×1024 px ensures that all elements are crisp and well-organized, enhancing readability and reducing cognitive load.
Customization is another strong point of Zentrix. The fully customizable layout allows users to adjust panels, rearrange metrics, and tailor the interface to their specific needs. With pixel-perfect design and well-organized layers, the dashboard maintains a clean and professional appearance while offering flexibility for different use cases.
Integrating Zentrix Into Your Existing Toolkit
Zentrix works best when integrated with other tools and platforms that support data analysis and audience insights. It complements tools like Google Analytics, Hotjar, and CRM systems by offering a more focused view of audience behavior. This integration allows users to cross-reference data from multiple sources, creating a more comprehensive understanding of their audience.
For teams using Figma for design work, Zentrix’s availability as a .fig file makes it easy to incorporate into existing design processes. The included help guide and font links ensure that users can quickly set up and customize the dashboard without needing extensive technical knowledge. This makes it an excellent choice for both designers and non-designers who want to leverage advanced analytics without getting bogged down by complexity.
When using Zentrix alongside other tools, it's important to maintain consistency in data interpretation. For instance, if you’re using heatmaps from Hotjar, Zentrix’s own heatmap indicators should be used to validate or expand upon those findings. This approach ensures that your insights are accurate and actionable across different platforms.
Practical Use Cases for Zentrix Audience Dashboard
One practical use case for Zentrix is in the early stages of a product development cycle. By analyzing user behavior on a prototype or beta version, teams can identify pain points and optimize the user experience before a full launch. The segmentation panels allow for targeted feedback collection, helping to prioritize features based on user preferences and needs.
During a content marketing campaign, Zentrix can help track which pieces of content resonate most with the audience. By monitoring engagement metrics and visitor maps, marketers can determine which topics or formats drive the most traffic and conversions. This insight enables them to refine their content strategy and focus on what works best.
After a project launch, Zentrix can be used for ongoing performance monitoring. Teams can track long-term engagement trends, assess the effectiveness of updates or changes, and make data-informed adjustments. The ability to switch between light and dark mode ensures that the dashboard remains usable in different environments, whether in a well-lit office or a dimly lit meeting room.
Best Practices for Using Zentrix Effectively
To get the most out of Zentrix, start by defining clear objectives for your data analysis. Are you trying to improve user retention, increase conversions, or understand audience behavior? Having a specific goal in mind will help you focus on the most relevant metrics and avoid distractions.
Organize your dashboard by grouping related metrics and panels. This not only improves usability but also makes it easier to spot trends and correlations. Regularly review and update your layout as your needs evolve, ensuring that the dashboard remains aligned with your goals.
Consistency in data interpretation is crucial. Make sure that all team members understand how to read and interpret the metrics presented in Zentrix. This reduces the risk of miscommunication and ensures that everyone is working with the same set of insights.
Finally, consider implementing quality control measures. Periodically verify the accuracy of the data being displayed and cross-check it with other sources when necessary. This helps maintain trust in the insights provided by Zentrix and ensures that decisions are based on reliable information.
Long-Term Benefits of Using Zentrix
Over time, Zentrix can become an essential part of your data strategy. Its intuitive design and powerful features make it a valuable tool for continuous learning and improvement. As your audience grows and evolves, Zentrix helps you stay ahead by providing timely and relevant insights.
For businesses, this means the ability to adapt quickly to changing market conditions. For creators and entrepreneurs, it offers a way to refine their offerings and connect more deeply with their audience. In any case, Zentrix supports a data-driven mindset that fosters innovation and growth.